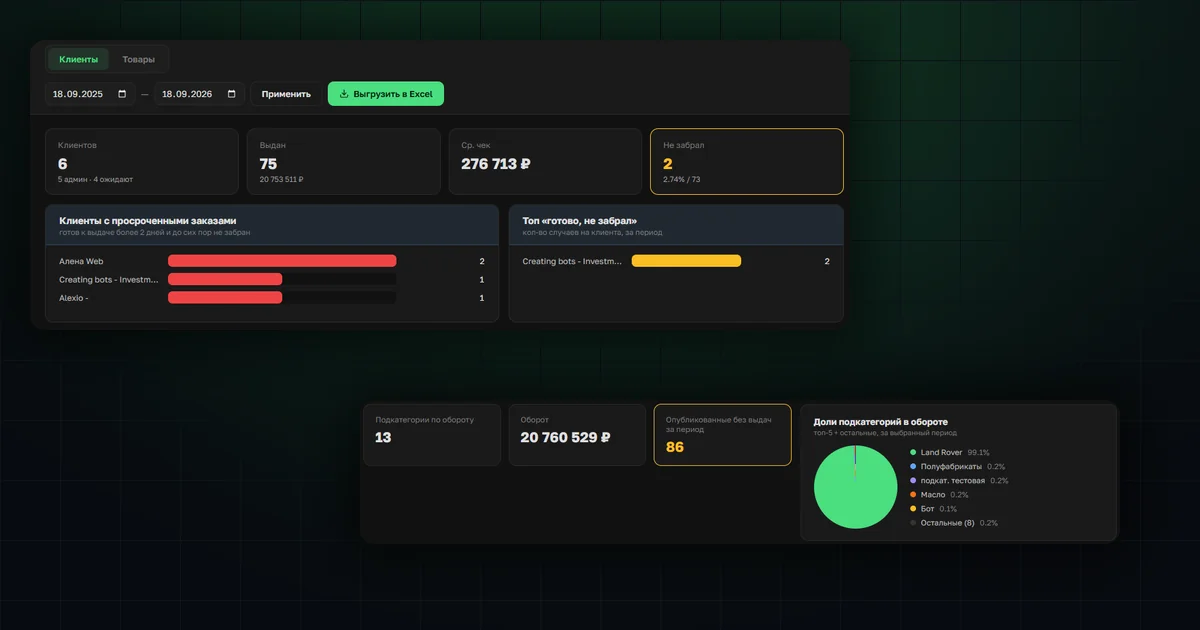
We've shipped a first version of customer and product reporting in OrderGrow, an e-commerce and group-buying app. In the "Statistics" section, owners of online stores, wholesale operations, and manufacturers now see aggregated data and first-pass analytics for quick decisions.
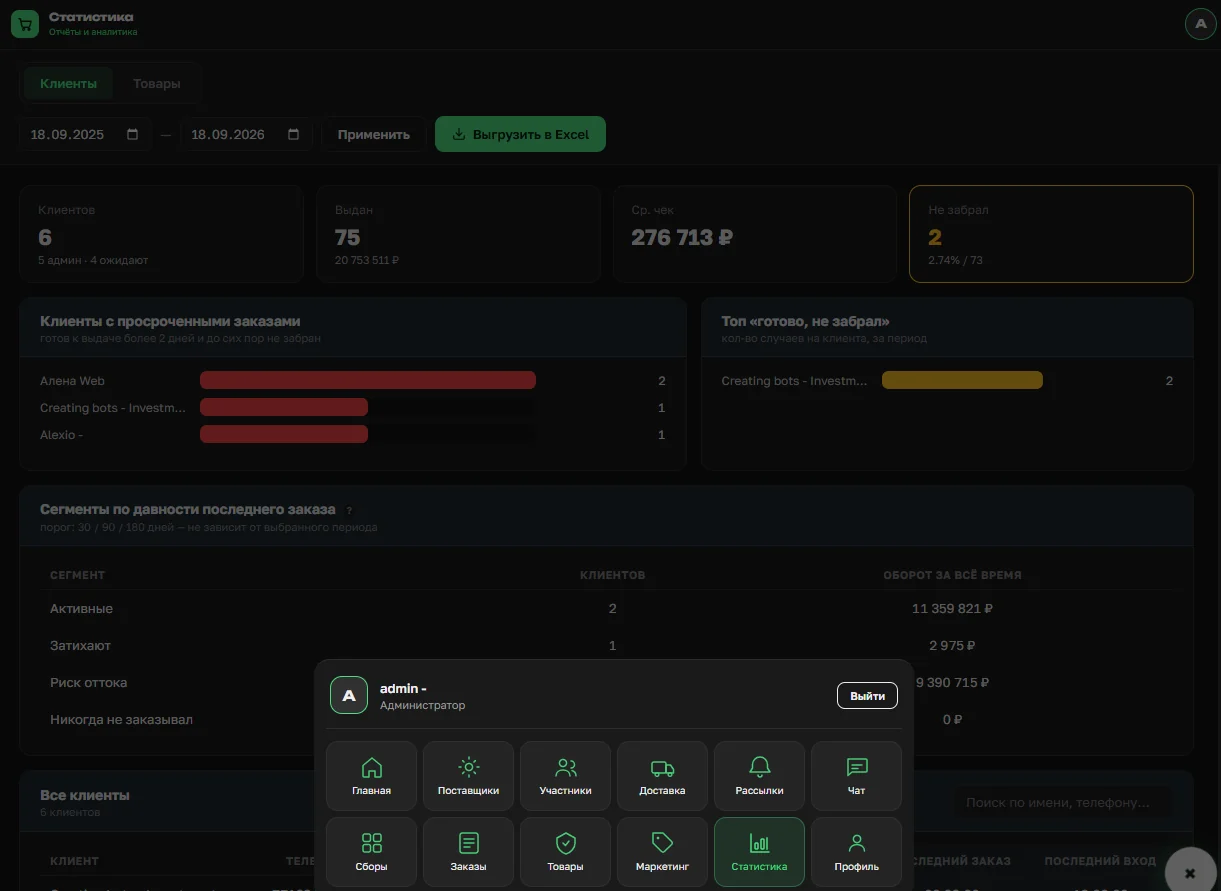
Overall summary
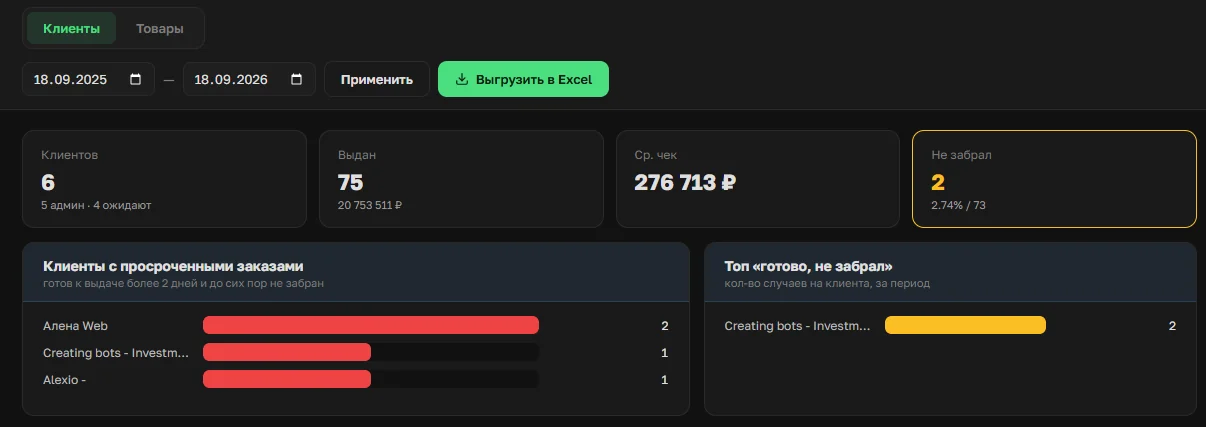
The first block is the big picture: the number of active customers in the database, how many of them are admins, how many are waiting to log in — either they couldn't sign in, or weren't given access details in time and are waiting for first access. Next to it: order data — how many were handed out, the average order value, and how many orders customers never picked up.
Customers with overdue orders, and items ready for pickup
Two blocks cover problem cases. "Customers with overdue orders" — if an order has been ready for pickup for more than two days (a common rule in shop policies), the customer shows up here with a count of such orders; details are already in the orders section. "Top 'ready, not picked up'" looks at the same customers from a different angle: potentially problematic buyers who don't come for their orders, also with a count of cases.
Segments by recency of last order
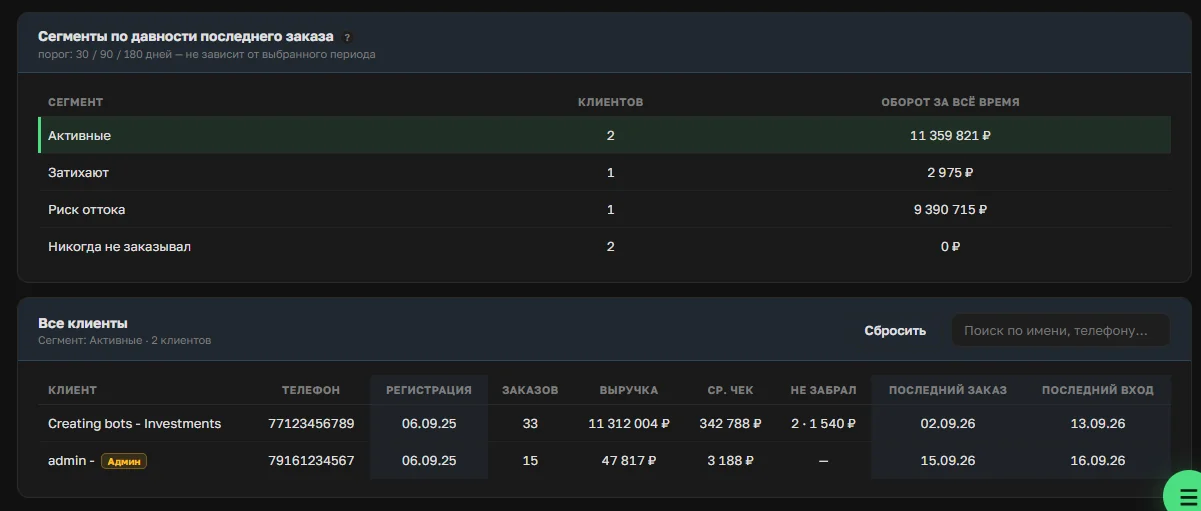
Below that is customer-base work by recency of last order: active, cooling off, at risk of churn, and never ordered. These are potentially competitors watching the shop, or people who haven't yet found a reason to make a first purchase.
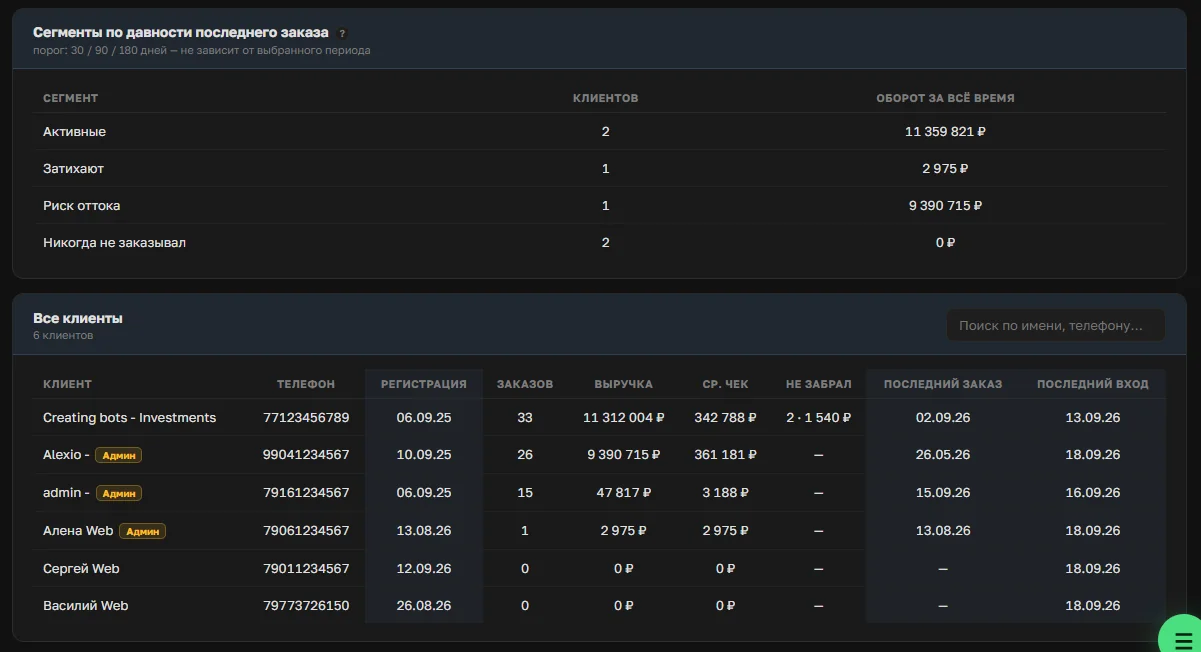
The block is interactive: clicking a segment builds a list of exactly those customers below it. If no segment is selected, all customers for the chosen period are shown by default (the period is set at the top of the section) — with contact details, registration date, number of orders, revenue, and other parameters.
Product statistics
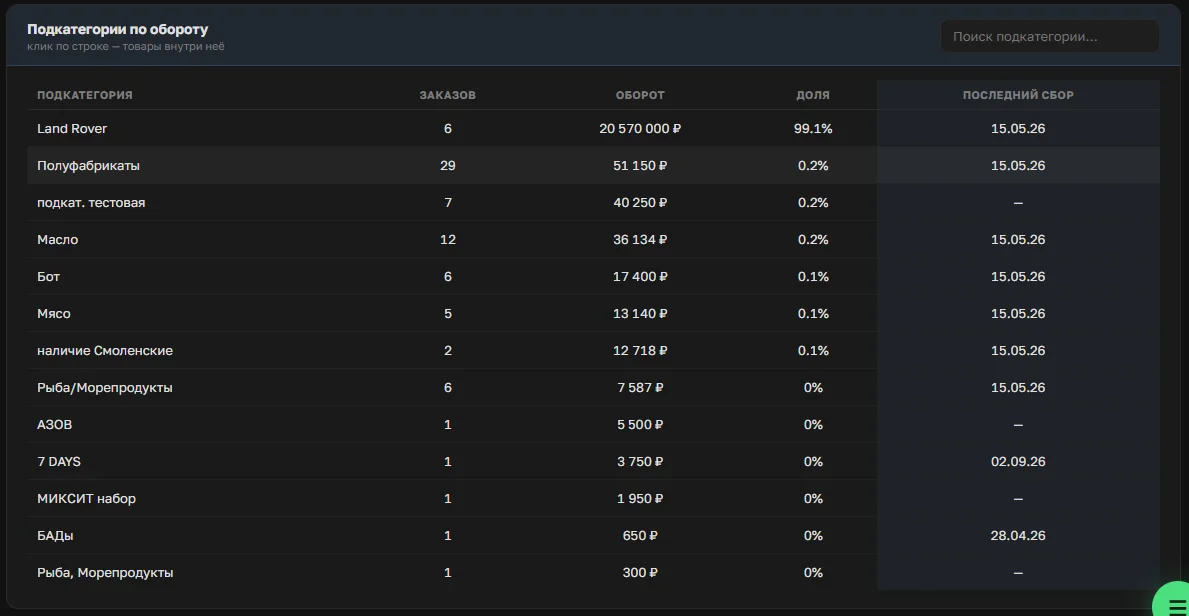
The products section works the same way, with a period selector at the top. The first part is a summary: how many subcategories exist in the system, turnover for the period, and each subcategory's share of that turnover.

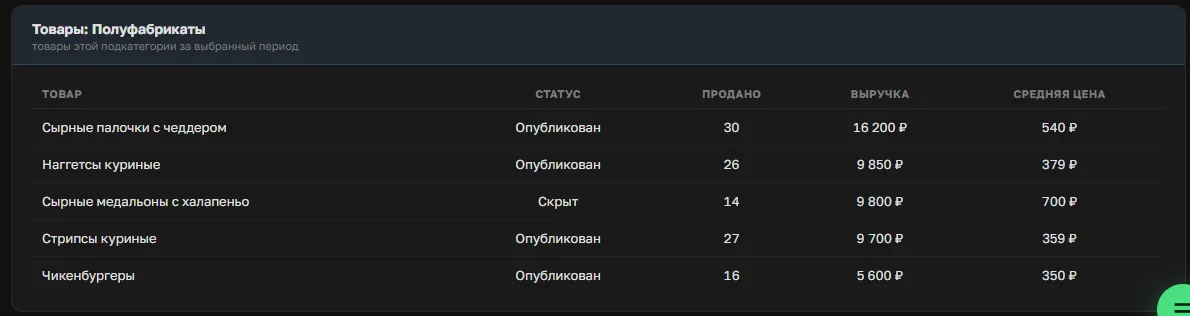
Below that is a table of subcategories with the key parameters: orders, turnover, share, and the date of the last collection they took part in. Clicking a subcategory expands its assortment with "Sold," "Revenue," and "Average price" — this builds on what we covered in the article on stock tracking.
A first-look dashboard, not a full analytics system
This section is closer to a dashboard than a full analytics system — but it's still enough for a first-pass read and to plan next steps: maybe reach out to a customer at risk of churn, push a product that's underexposed, or drop one that isn't earning its shelf space.
What's next
The "Statistics" section is already available in the app. Try the group-buying app in full, customer and product analytics included, at OrderGrow Lab — seven days free, no card required.